从源码安装 Xdebug
下载解压
Xdebug 官方下载地址
下载最新版本源码,并解压
[root@localhost ~]# wget https://xdebug.org/files/xdebug-2.9.0.tgz
[root@localhost ~]# tar xzvf xdebug-2.9.0.tgz
[root@localhost ~]# cd xdebug-2.9.0
编译安装
用 phpize 配置 xdebug 源码
[root@localhost xdebug-2.9.0]# phpize
[root@localhost xdebug-2.9.0]# ./configure
[root@localhost xdebug-2.9.0]# make && make install
在 php.ini 中加入以下配置
zend_extension=xdebug.so
xdebug.remote_enable=1
xdebug.remote_autostart=1
xdebug.remote_port=9000
xdebug.remote_connect_back=1
xdebug.auto_trace=1
xdebug.remote_log=/tmp/xdebug.log
重启 php-fpm 完成安装,命令行输入 php -v 可以看到
PHP 7.3.10 (cli) (built: Oct  7 2019 13:52:56) ( NTS )
Copyright (c) 1997-2018 The PHP Group
Zend Engine v3.3.10, Copyright (c) 1998-2018 Zend Technologies
    with Xdebug v2.9.0, Copyright (c) 2002-2019, by Derick Rethans
    with Zend OPcache v7.3.10, Copyright (c) 1999-2018, by Zend Technologies
其中有 with Xdebug v2.9.0, Copyright (c) 2002-2019, by Derick Rethans 说明 xdebug 安装完成
配置 vscode
安装 vscode 相关插件
安装 PHP Debug 插件,创建如下配置文件
{
    // Use IntelliSense to learn about possible attributes.
    // Hover to view descriptions of existing attributes.
    // For more information, visit: https://go.microsoft.com/fwlink/?linkid=830387
    "version": "0.2.0",
    "configurations": [
        {
            "name": "Listen for XDebug",
            "type": "php",
            "request": "launch",
            "pathMappings": {
                "/data/wwwroot/test": "${workspaceRoot}",
            },
            "port": 9000
        }
    ]
}
其中 /data/wwwroot/test 是对应的远程目录
开调试
打开 vscode 中的 PHP Debug 插件
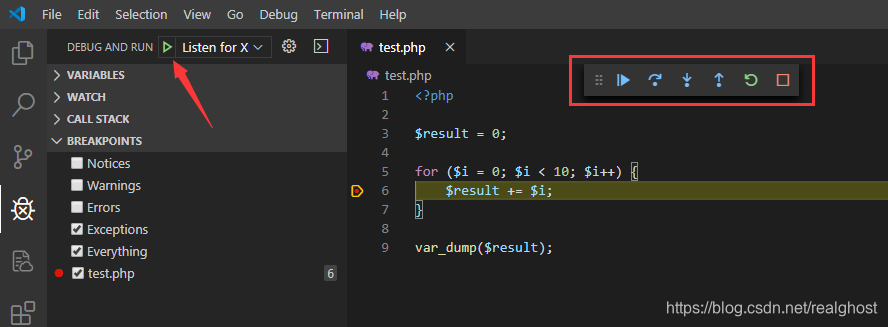 在代码设置断点,运行代码。
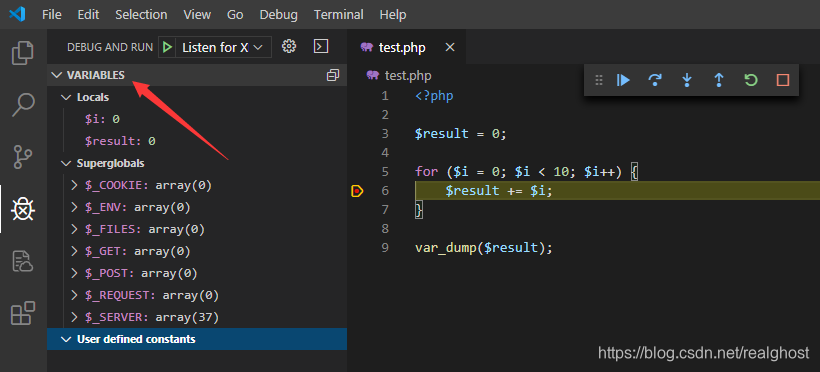
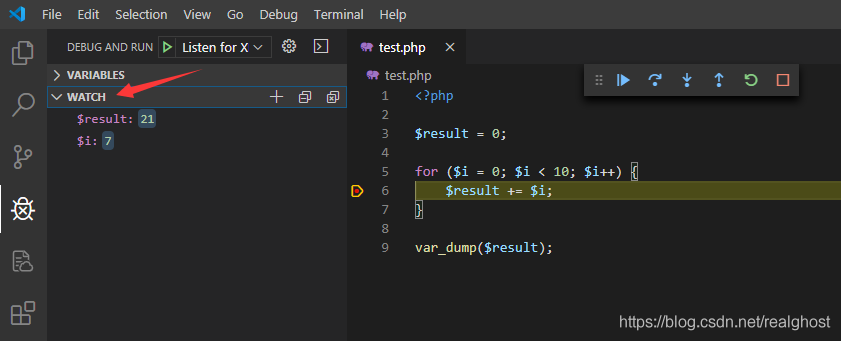
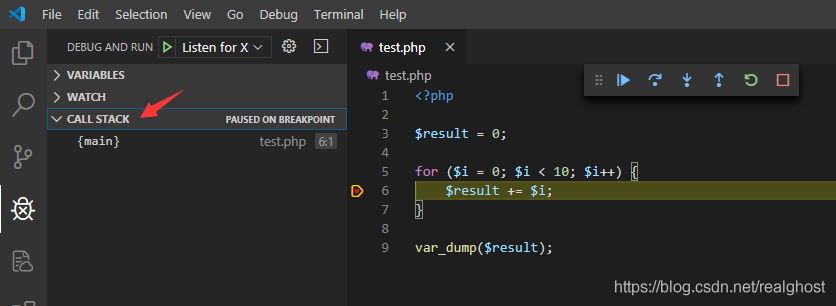
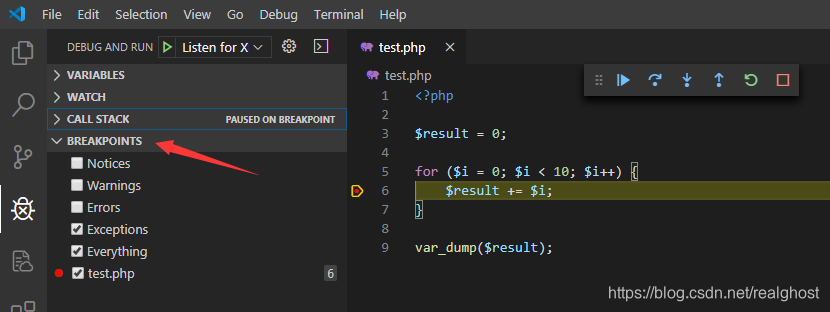
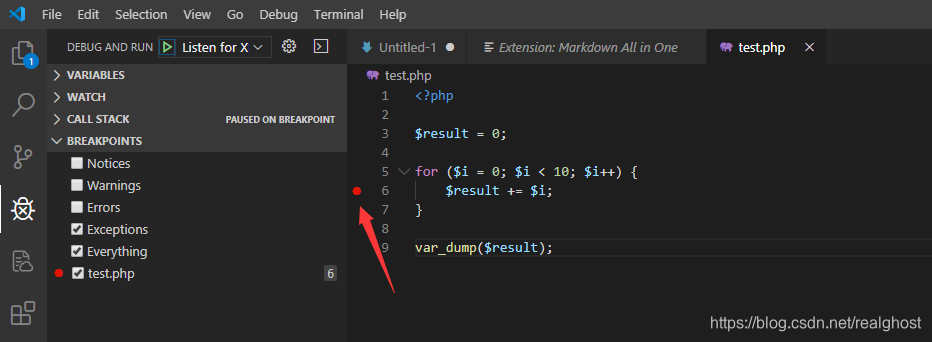 当执行到断点时,会在 vscode 中停住,可以使用调试按钮来控制程序的执行;在左边的
 VARIABLES 窗口中查看代码变量值;在 WATCH 窗口中观察自定义表达式的值;在 CALL STACK 中查看调用堆栈信息;在 BREAKPOINTS 窗口中查看断点情况
容易遇到的问题
日志
在 xdebug 的配置里
xdebug.remote_log=/tmp/xdebug.log是指定日志文件的位置,如果遇到问题可以通过打开这个选项,输出日志,来分析问题的原因。
正常日志一般是以下内容(以一次脚本执行为例)
[25076] Log opened at 2019-12-26 08:49:51
[25076] I: Checking remote connect back address.
[25076] I: Checking header 'HTTP_X_FORWARDED_FOR'.
[25076] I: Checking header 'REMOTE_ADDR'.
[25076] I: Remote address found, connecting to 192.168.5.119:9000.
[25076] I: Connected to client. :-)
[25076] -> <init xmlns="urn:debugger_protocol_v1" xmlns:xdebug="https://xdebug.org/dbgp/xdebug" fileuri="file:///data/wwwroot/t/test.php" language="PHP" xdebug:language_version="7.3.8" protocol_version="1.0" appid="25076" idekey="www"><engine version="2.7.2"><![CDATA[Xdebug]]></engine><author><![CDATA[Derick Rethans]]></author><url><![CDATA[https://xdebug.org]]></url><copyright><![CDATA[Copyright (c) 2002-2019 by Derick Rethans]]></copyright></init>
[25076]
[25076] <- breakpoint_list -i 1
[25076] -> <response xmlns="urn:debugger_protocol_v1" xmlns:xdebug="https://xdebug.org/dbgp/xdebug" command="breakpoint_list" transaction_id="1"></response>
[25076]
[25076] <- breakpoint_set -i 2 -t line -f file:///d:/t/test.php -n 2
[25076] -> <response xmlns="urn:debugger_protocol_v1" xmlns:xdebug="https://xdebug.org/dbgp/xdebug" command="breakpoint_set" transaction_id="2" id="250760001"></response>
[25076]
[25076] <- breakpoint_list -i 3
[25076] -> <response xmlns="urn:debugger_protocol_v1" xmlns:xdebug="https://xdebug.org/dbgp/xdebug" command="breakpoint_list" transaction_id="3"><breakpoint type="line" filename="file:///d:/t/test.php" lineno="2" state="enabled" hit_count="0" hit_value="0" id="250760001"></breakpoint></response>
[25076]
[25076] <- breakpoint_list -i 4
[25076] -> <response xmlns="urn:debugger_protocol_v1" xmlns:xdebug="https://xdebug.org/dbgp/xdebug" command="breakpoint_list" transaction_id="4"><breakpoint type="line" filename="file:///d:/t/test.php" lineno="2" state="enabled" hit_count="0" hit_value="0" id="250760001"></breakpoint></response>
[25076]
[25076] <- breakpoint_set -i 5 -t exception -x Notice
[25076] -> <response xmlns="urn:debugger_protocol_v1" xmlns:xdebug="https://xdebug.org/dbgp/xdebug" command="breakpoint_set" transaction_id="5" id="250760002"></response>
[25076]
[25076] <- breakpoint_set -i 6 -t exception -x Warning
[25076] -> <response xmlns="urn:debugger_protocol_v1" xmlns:xdebug="https://xdebug.org/dbgp/xdebug" command="breakpoint_set" transaction_id="6" id="250760003"></response>
[25076]
[25076] <- breakpoint_set -i 7 -t exception -x Error
[25076] -> <response xmlns="urn:debugger_protocol_v1" xmlns:xdebug="https://xdebug.org/dbgp/xdebug" command="breakpoint_set" transaction_id="7" id="250760004"></response>
[25076]
[25076] <- breakpoint_set -i 8 -t exception -x Exception
[25076] -> <response xmlns="urn:debugger_protocol_v1" xmlns:xdebug="https://xdebug.org/dbgp/xdebug" command="breakpoint_set" transaction_id="8" id="250760005"></response>
[25076]
[25076] <- breakpoint_set -i 9 -t exception -x *
[25076] -> <response xmlns="urn:debugger_protocol_v1" xmlns:xdebug="https://xdebug.org/dbgp/xdebug" command="breakpoint_set" transaction_id="9" id="250760006"></response>
[25076]
[25076] <- run -i 10
[25076] -> <response xmlns="urn:debugger_protocol_v1" xmlns:xdebug="https://xdebug.org/dbgp/xdebug" command="run" transaction_id="10" status="stopping" reason="ok"></response>
[25076]
[25076] <- stop -i 11
[25076] -> <response xmlns="urn:debugger_protocol_v1" xmlns:xdebug="https://xdebug.org/dbgp/xdebug" command="stop" transaction_id="11" status="stopped" reason="ok"></response>
[25076]
[25076] Log closed at 2019-12-26 08:49:51
前面的是连接状态, I: Connected to client. :-) 表示连接成功
[25076] Log opened at 2019-12-26 08:49:51
[25076] I: Checking remote connect back address.
[25076] I: Checking header 'HTTP_X_FORWARDED_FOR'.
[25076] I: Checking header 'REMOTE_ADDR'.
[25076] I: Remote address found, connecting to 192.168.5.119:9000.
[25076] I: Connected to client. :-)
后面的就是具体的 xdebug 发送的控制调试的内容
[25076] -> <init xmlns="urn:debugger_protocol_v1" xmlns:xdebug="https://xdebug.org/dbgp/xdebug" fileuri="file:///data/wwwroot/t/test.php" language="PHP" xdebug:language_version="7.3.8" protocol_version="1.0" appid="25076" idekey="www"><engine version="2.7.2"><![CDATA[Xdebug]]></engine><author><![CDATA[Derick Rethans]]></author><url><![CDATA[https://xdebug.org]]></url><copyright><![CDATA[Copyright (c) 2002-2019 by Derick Rethans]]></copyright></init>
[25076]
[25076] <- breakpoint_list -i 1
[25076] -> <response xmlns="urn:debugger_protocol_v1" xmlns:xdebug="https://xdebug.org/dbgp/xdebug" command="breakpoint_list" transaction_id="1"></response>
E: Could not connect to client. :-( 错误
日志输出
[24422] Log opened at 2019-12-26 08:06:58
[24422] I: Connecting to configured address/port: 127.0.0.1:9000.
[24422] W: Creating socket for '127.0.0.1:9000', poll success, but error: Operation now in progress (29).
[24422] E: Could not connect to client. :-(
[24422] Log closed at 2019-12-26 08:06:58
这一般是配置文件错误,在配置文件里指定了 xdebug.remote_host 这个值
xdebug.remote_host=127.0.0.1因为 IDE 是本地,运行环境是远程虚拟机,对于 xdebug 来说, remote_host 指的是 IDE 的地址,这里填的是 127.0.0.1 是没有监听的,所以会报 E: Could not connect to client. :-( 错误。
这里可以不填 xdebug.remote_host 这个值,把 xdebug.remote_connect_back 打开,xdebug 根据连接来自动获取远程主机的地址,就能解决这个问题。
E: Time-out connecting to client (Waited: 200 ms). :-( 错误
日志输出
[25460] Log opened at 2019-12-27 03:19:32
[25460] I: Checking remote connect back address.
[25460] I: Checking header 'HTTP_X_FORWARDED_FOR'.
[25460] I: Checking header 'REMOTE_ADDR'.
[25460] I: Remote address found, connecting to 192.168.5.119:9000.
[25460] E: Time-out connecting to client (Waited: 200 ms). :-(
[25460] Log closed at 2019-12-27 03:19:32
可以看到找到了远程的 IP 地址,但是连接超时了。
这个问题一般是 IDE 所在机器的防火墙把 xdebug 的连接给拦截了,检查 IDE 所在机器的防火墙,打开相应的端口即可解决问题。